7 types of feedback that helped make GOV.UK awesome
06 Jun 2013I remember going to the dentist one time and being told off for having a bad brushing technique. As well as causing mild embarrassment, the rebuke got me thinking about feedback cycles - assuming that I adjusted my brushing, when would I notice a difference? Plaque build-up isn’t something that’s easy to pick up at home, and most people don’t go to the dentist more often than every 6 months (if that often at all) - so short of marrying a dentist, or using those plaque-marking tablets (which leave a nice blue glow on your teeth), you’re left with a 6 month feedback cycle. Which sucks.
With software, feedback can be cheap and frequent, although bizarrely, most product teams in the industry are content with just whatever came out of the few functional and non-functional tests run by their dedicated QA team. By virtue of doing automated testing, TDD, continuous integration, code reviews, retrospectives, smoke & perf testing, the Government Digital Service (GDS) team that built GOV.UK (the UK central government’s publishing portal) is already well ahead of the curve, but those things aren’t really new - all good teams are doing most of those nowadays. I’ve chosen to highlight the techniques below because either I haven’t seen them in action before, or because I was rather surprised to see them being used by a 250+ person team running a nation’s critical IT infrastructure.
Here are the topics, in no particular order:
- releasing early
- product analytics
- performance dashboards
- user research
- accessibility testing
- devops
- direct user feedback
Note : at the bottom of each section, I’ve included links to that topic in the Government Service Design Manual and on the GDS blog.
1. Releasing early
The alpha
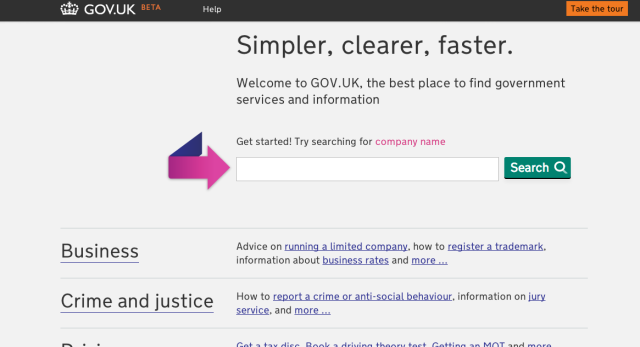
Instead of beginning to develop GOV.UK in stealth mode, GDS built a prototype - the alpha version - and released it. Alphagov, as it was called, was built in 12 weeks, cost £261,000 and was delivered only a day late - and the 12 weeks included time for hiring and building the team. You can still see Alphagov on the National Archives website - compared to GOV.UK now, it looks very rough, but that was intentional - the alpha was designed to optimise learning, not to deliver a finished service (a minimum viable product, in Lean Startup lingo).
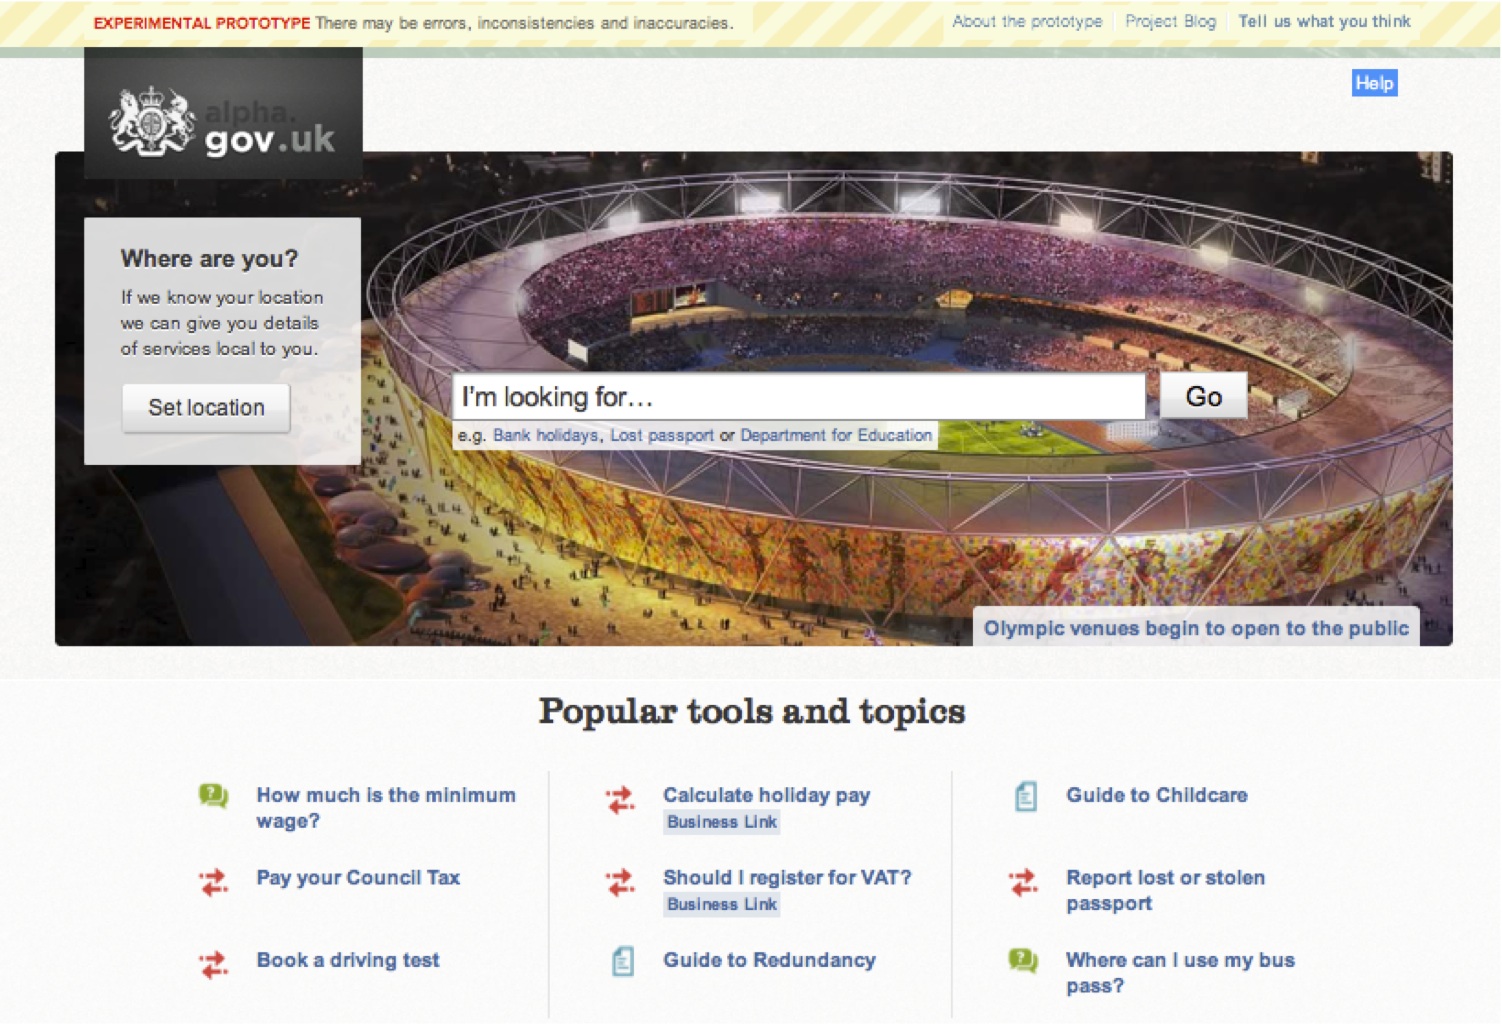 The GOV.UK alpha at launch. Tom Loosemore, GDS Blog
Not every team has the guts to do this - releasing early left the GOV.UK team exposed to criticism (eg check out the ruckus that erupted in the comments of the announcement that the alpha wasn’t going to focus on accessibility), but also allowed them to gather invaluable feedback - from fellow civil servants, from readers of the GDS blog, via Twitter, email and through user feedback tools such as GetSatisfaction. Driving real traffic through the site exposed problems with browser/device combinations that in-house testing would never picked up. More importantly, the alpha allowed gathering enough data to decide whether the team’s underlying approach was sound, and whether the project should be continued in its current form.
The beta
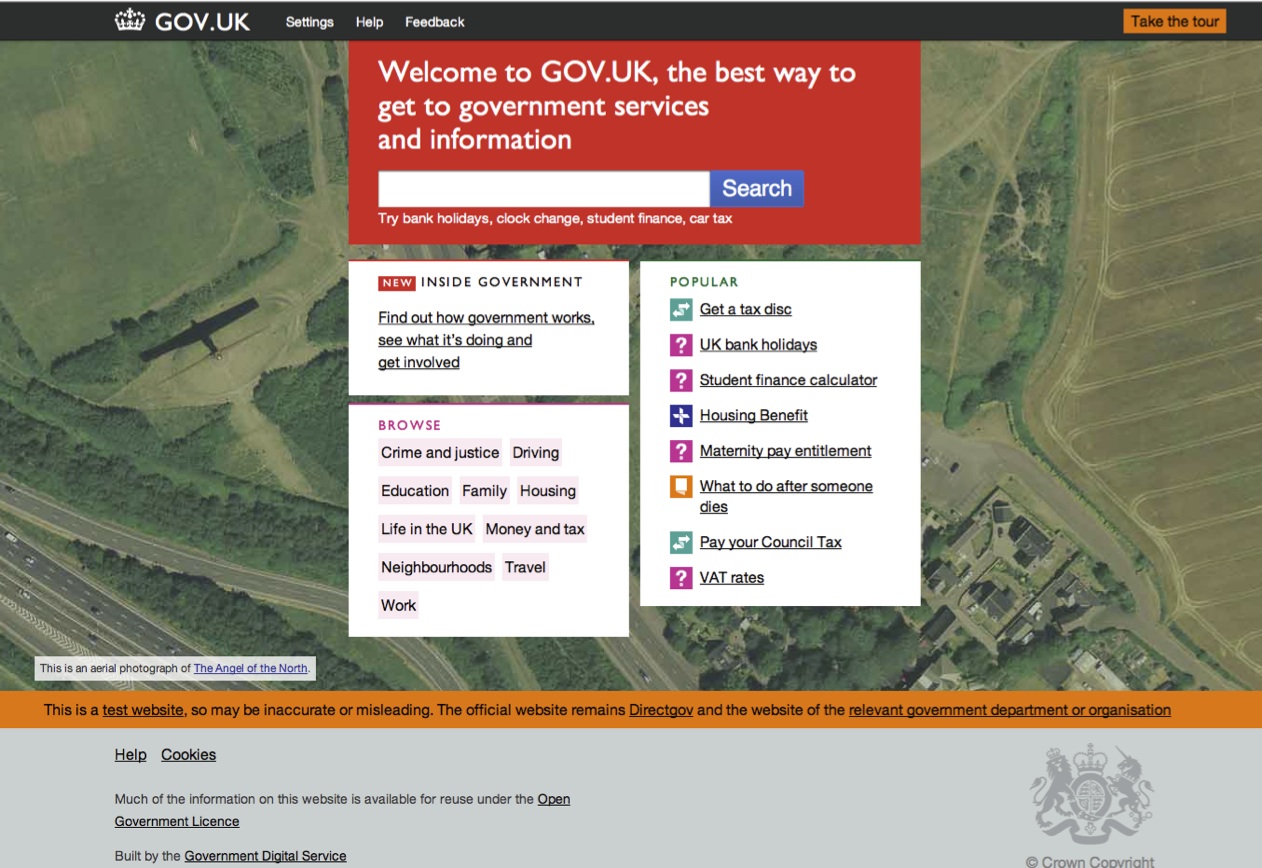 The GOV.UK beta when it was first launched. Tom Loosemore, GDS Blog
The GOV.UK beta took several months to develop and was a more complete, end-to-end prototype. It allowed the team to start observing usage patterns, and confirm or invalidate assumptions about user behaviour. It allowed the team to refine the content formats and editorial style, refine the content itself, practice deployments, so that when it came to switch the service on, it was no more than re-routing live traffic (which the team practised beforehand as well); the site had effectively been live for months already.
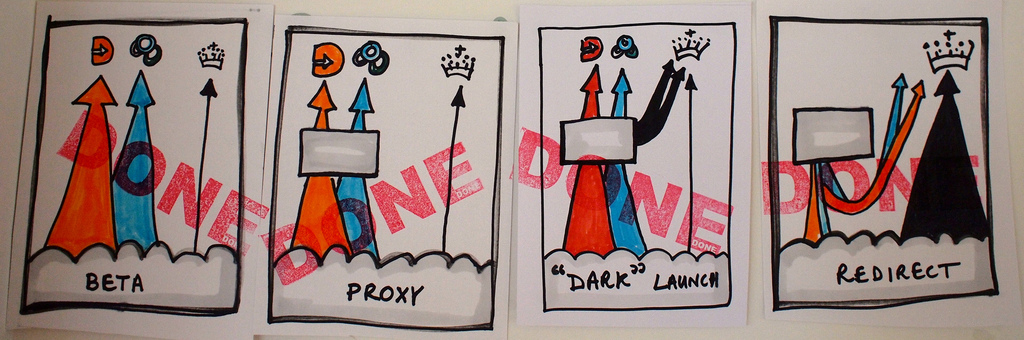 How the redirection works, Paul Downey, GDS Blog
shipped a nation's website. No biggie.
— Paul Downey (@psd) October 17, 2012
(More on the alpha in the Service Manual and GDS blog, and the beta in the Service Manual)
2. Product analytics
Pre-launch
One of GDS’s design principles is “design with data”. During the alpha and beta, the GOV.UK web analytics team pulled visitor traffic data from sites that GOV.UK was going to replace - Directgov, Business Link and individual departmental websites, and used it to:
- Decide whether to migrate or drop content. To keep GOV.UK as lean as possible, not all Directgov/Business Link content was migrated across; the visitor analytics data helped make the decision about what to migrate and what to leave.
- Identify nuances around specific user needs. The long tail of search terms (and related terms) exposed a number of variations of the same user goal. The most popular ones could be grouped and answered by separate “nodes”.
- Identify how users were finding the content. The data showed that between 50-60% of traffic came from search engines, and allowed the team to find the highest searched-for terms, and optimise the content URLs accordingly.
- Identify which browsers and devices to support and test with. helped figure out which browsers to support and not to support (eg allowed team to decide to drop support for IE6, make mobile and tablets a focus)
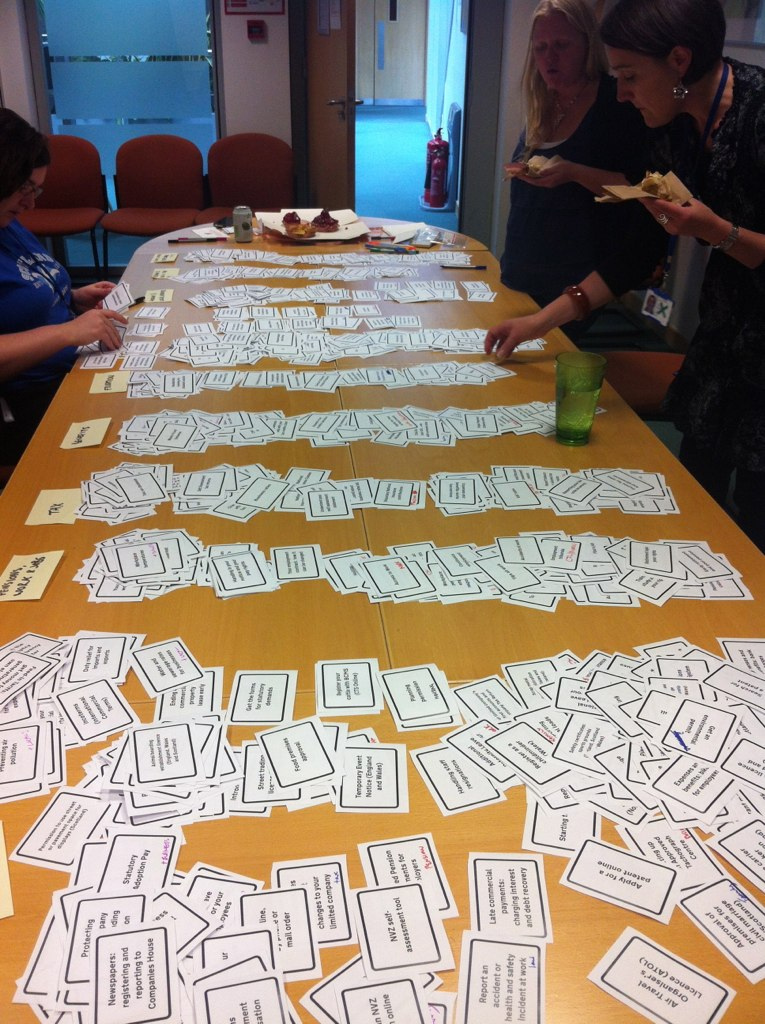 Sorting user needs, Tom Loosemore, GDS Blog
Post-launch
While a new feature is being built, the product and analytics team would define what success looks like for that feature. As an example, a user is considered to have successfully engaged with the content using the ’guide’ format if they spend at least 7 seconds on the page, or click a link within the body of the page. With the definition in hand, tracking of those metrics is implemented, allowing automatic measurement of the success rate post-launch. Some of this information may then be pushed into the GDS performance platform and presented on dashboards or internal tools. GOV.UK analytics also enables in-depth ad-hoc analysis of specific features or formats. Since there are strongly defined seasonal trends in GOV.UK traffic, the visitor data can help with capacity planning in the user support team.
(Analytics in the Service Manual and on the GDS blog)
3. Performance dashboards
Product dashboards are a tricky proposition: if they fail to present the data clearly, they end up being ignored (or worse still, being misleading), making all the hard work of exposing and processing the data a complete waste. In too many products, the dashboard is an afterthought, added by a developer in his spare time. By contrast, the GOV.UK dashboards - one for citizen content and another for the Inside Government content - has been given as much design attention as the rest of the site. I really like their simplicity and focus - the GDS Performance team has done a really good job.
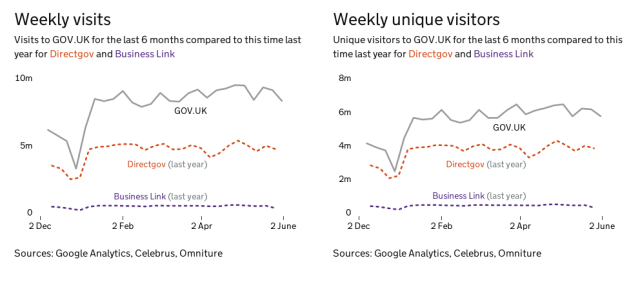 GOV.UK replaced DirectGov and Business Link in Oct ‘13
For example, the above graph makes it obvious that GOV.UK is receiving significantly more traffic now than its predecessor sites were getting this time last year.
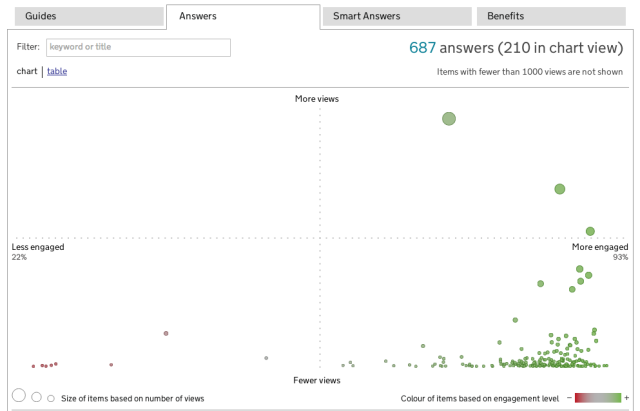
Being able to clearly categorise content by traffic and performance gives the content teams clear priorities about which content to improve first (ie high-traffic, poor-performing content).
While not being strictly about GOV.UK, I want to highlight some other awesome work that the Performance team (and others in GDS) have done around transactions, most notably the transactions explorer tool. Here is a (jaw-dropping) list of the highest-volume transactions, ordered by cost per transaction:

4. User research
A couple of days ago, I overheard two GDS developers talking after seeing a user testing session, with one saying to the other: “There’s nothing like user testing to show you all the things you’ve done wrong” (this is a paraphrase, I don’t recall the exact words). It’s obviously tough to watch users rip the work you’ve spent all that time and effort doing to shreds, but still a million times better than the same happening after the feature has been launched.
Constant user testing of different parts of the site is just one of the main responsibilities of the user research team:
Once the website data starts telling us what the users are doing, we’re pretty sure our colleagues will want to know why – and that’s where the Insight and Usability Team can help.
(from Testing GOV.UK with real users, GDS blog)
In the early stages of building a new product, the product team conducts user research to understand users and their environment, and test proposed solutions using wireframes or low-fi (ie paper or static HTML) prototypes.
GOV.UK underwent numerous rounds of lab testing, with each round focusing on a subset of features and content (eg the homepage, search, or specific calculators); the users were selected to be as close to the target audience of the content or tool being tested. To reduce the amount of bias, the user group included diverse ages, sexes, professions and varying skills of online proficiency. Each round uncovered new and interesting usability failures, and the team responding with several major redesigns, as well as hundreds of minor tweaks.
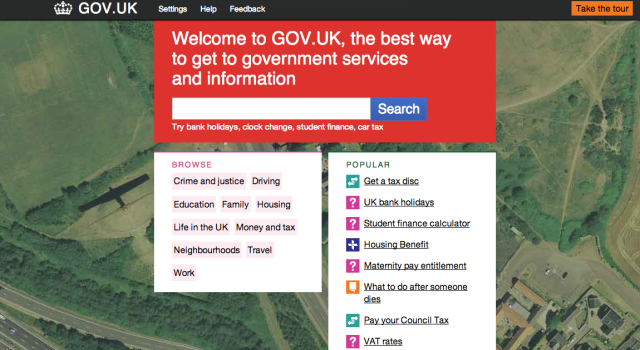
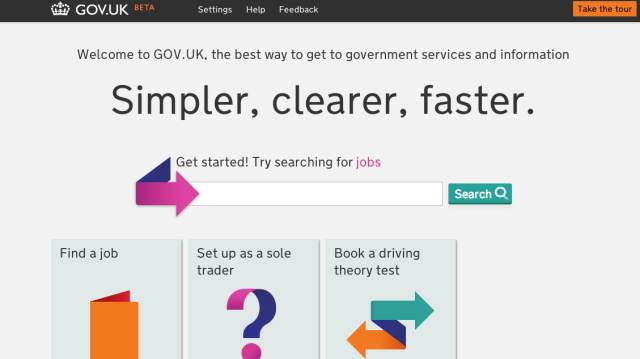
Some features, like the homepage, took several iterations to get right (and more changes are being planned in the future):
 Homepage at the Beta launch
 Homepage that looks less like a parking page
 Homepage without the confusing iconography
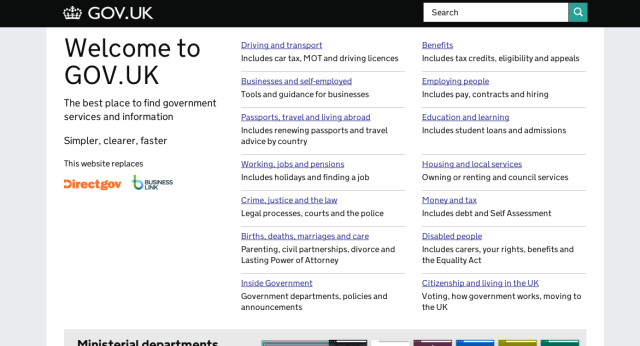 Homepage design at the time of launch (where search takes a back seat)
Notice how in the final version, the search bar is de-emphasised. This change was made as a result of user testing that showed that users who preferred search would come in through Google anyway; those coming in through the homepage needed to be able to browser through categories to get to the content they were looking for. Users also preferred seeing all of the categories and their descriptions above the fold of the page, as it gave them a better sense about the scope of the site.
Apart from the lab-based user testing that I’ve described, the user research team also ran remote usability tests (here’s an example report from a testing round of the GOV.UK Inside Government features) and guerilla testing.
(User research in the Service Manual and on the GDS blog)
5. Accessibility testing
It’s been GDS’s view from the very beginning that compliance with technical accessibility standards (eg WCAG2.0 ‘AA’), while checking the legal tick-boxes, would in itself not be sufficient to make GOV.UK usable and useful for disadvantaged users. Consequently, success would depend on doing extensive testing, and the testing would have to cover the content, not just the interaction design - here’s a post about user testing with deaf customers at the DVLA that illustrates this point well.
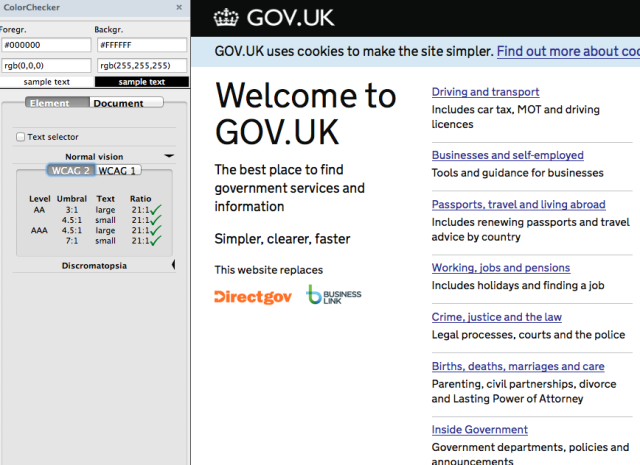 Checking colour contrast standards compliance with the WCAG Contrast Checker Firefox plugin
Internal testing
From the start of the GOV.UK beta, Léonie Watson (a recognised accessibility expert) has been working with the team as a consultant alongside Joshua Marshall, the GOV.UK accessibility lead. Léonie and Joshua run continuous internal testing on parts of the site that are in active development: Léonie tests from the point of view of an expert screen reader user, and Joshua runs the site through various simulators and accessibility checkers, as well as interacting through different assistive technologies, such as screen readers, magnifiers, and speech recognition software.
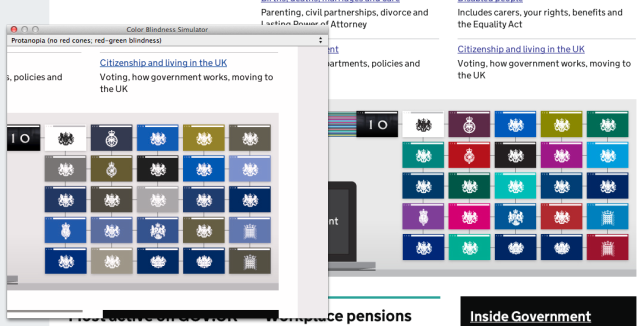 Simulating common types of colour blindness with Sim Daltonism, a OS X-based colour blindness simulator
External testing with users
Each distinct GDS product ideally sees at least two user testing rounds before its launch: one round at the end of an alpha, and another one at the end of a beta phase, so that it is possible to measure whether improvements have been made. If the product has a similar interaction to something that has been previously tested (eg if a transaction uses the same layout and colour schemes) then it may only get one round with disabled users. The participants on the trials are chosen to represent a variety of user groups: blind screen-reader users, screen magnification users, deaf British Sign Language users, keyboard-only users, speech-recognition software users, Dyslexic users, and Aspergers or autistic users.
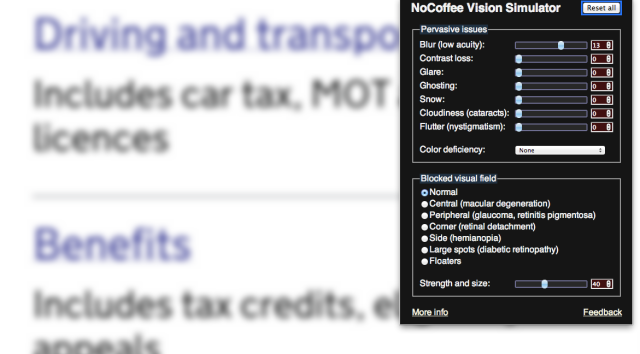 Blurred vision simulation with the NoCoffee vision simulator plugin for Google Chrome - the fonts are magnified for legibility
So what has the testing found?
Similar to user testing with other user groups, each round of testing with disabled users showed that the site’s accessibility was improving, but still exposed new (lesser-severity) problems. The homepage and search were two areas that experienced large churn, with many smaller adjustments done to colour schemes, links and markup structure.
(Accessibility in the Service Design Manual and on the GDS Blog)
6. DevOps
GOV.UK is operated using the DevOps model, which is really just a way to say “developers and operations people building live services together” - the polar opposite of the “throw it over the wall” mentality that breeds as a result of having separated operations and development teams.
The deal
How it works in practice: a sizeable proportion of the developers have full unrestricted access to the production servers, as well as the deployment and configuration management code repositories. Furthermore, they are actively encouraged to configure their own production systems, write the deployment code and deploy releases themselves. This excuses them from having to do heavyweight, painful handovers, but it does mean that they have to fix production if they break it.
The infrastructure and ops team takes care of spinning up new machines, sorting out the network configuration, various data storage options (with redundancy, failover and backups), security and hardening, and many other things. The ops guys make sure that the platform runs smoothly, and they put the tools in place to expose important information from production (like logs, monitoring counters and alerts). Because they aren’t on the hook to fix application issues, they have time to help the developers out with setting up development and test environments.
A developer’s perspective
idea 7:45am, code committed at 8:01am, code reviewed by 9:56am, tested by 10:10am, deployed on Govt infrastructure 10:20am @gdsteam rocks!
— Jake Benilov (@benilov) May 30, 2013
For an application developer such as myself, this is a really good setup:
- I have a very good understanding of how my application is doing at any time
- I get almost instantaneous notification when production problems occur
- because the release cadence is driven by the application teams, I can release pretty much whenever there’s a slot available
- I am less likely to develop something that will work badly on production, because I have a tested the code in a development environment that is very similar to production
- by writing the deployment and configuration code together with the infrastructure team, my deployment bugs and system misconfigurations are caught very early.
The results speak for themselves: in May, the 1000th code change was made to GOV.UK, making the average about 7 updates per working day since launch.
(Infrastructure and operations in the Service Manual)
7. Direct user feedback
There are a few ways in which a visitor to GOV.UK can contact GDS directly. The most obvious one is through a standard contact form, but it can also be done through Twitter or the GDS blog. Additionally, every page in the citizen section of the site offers the opportunity to leave feedback:
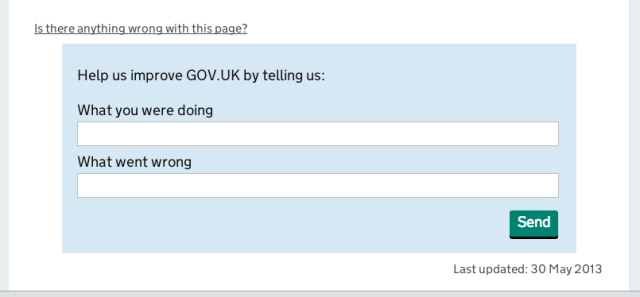
Even when a user encounters a broken link, the site solicits feedback:
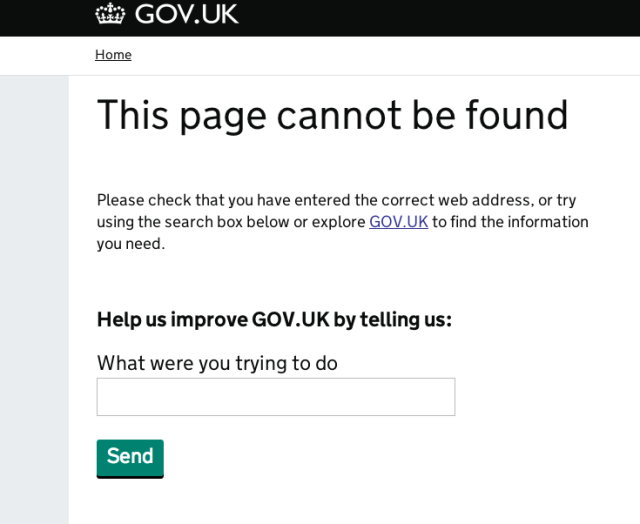
Each user submission is funnelled into the GOV.UK ticketing system and is handled by the User Support team, who help the user whenever they can, or pass the query through to the relevant part of government when they can’t.
User feedback as monitoring
Unclear or problematic content invariably generates more user feedback, so a spike in user complaints tends to mean that there is a breakage somewhere on GOV.UK or a service that it links out to - as soon as such a spike is identified, the underlying problem is investigated and the relevant GDS or departmental team is immediately notified. In effect, this process acts as another layer of monitoring of the system’s health.
Seeing the trends
To identify longer-term trends, the team looks at both the absolute numbers of user questions, as well as the ratio between amount of page traffic and the number of questions. The content teams then use aggregated reports of the user feedback to really dig into the problems and understand the cause of the confusion or frustration.
(User support in the Service Manual)